Solar Cycle
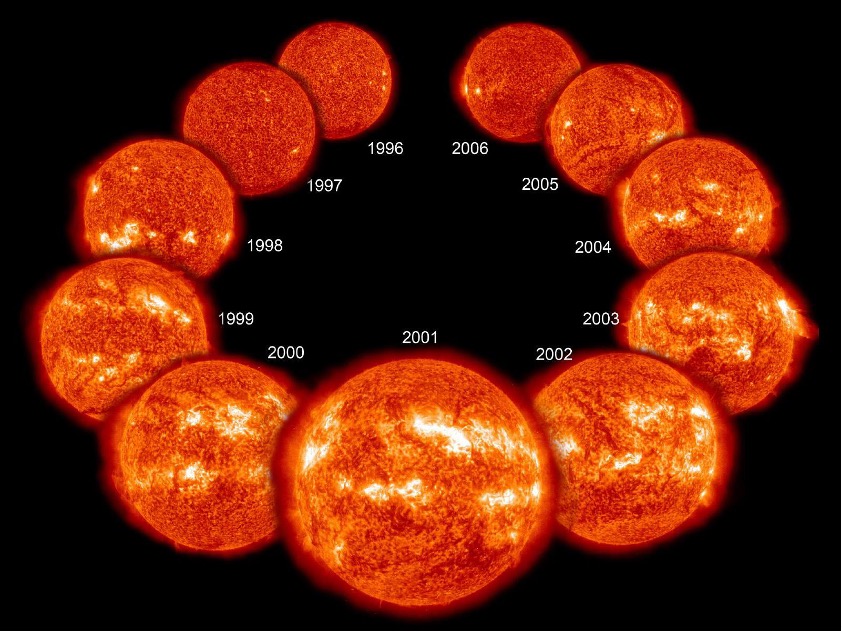
Seasons on the Sun
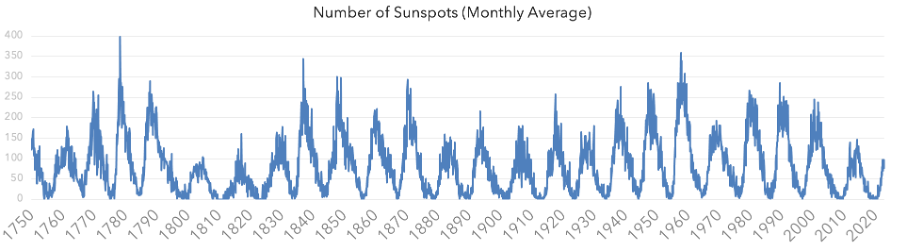
Sunspots are cooler regions on the sun’s surface that appear as dark spots[1] that have been observed since ancient times[2]. Most sunspots are relatively short-lived and disappear within a few days, although very large ones sometimes last for several weeks[3] or even months[4]. Bright spots, known as faculae and plages appear together with sunspots during times of increased solar activity. Just like the seasons on Earth, activity on the sun rises and falls in a cyclical pattern that repeats every 11 years[5]: The solar cycle is only quasi-periodical, meaning that both its length and amplitude varies[6]. Thanks to careful observations dating back almost 400 years (one of the longest spanning scientific data series based on direct observation)[7], there is ample evidence for this cyclical pattern, which is further supported by indirect data, such as carbon-14 isotope ratios in tree rings[8]: When high-energy radiation from space strikes Earth’s atmosphere, it turns some of the nitrogen atoms into radioactive carbon-14 (also known as radiocarbon) that gets dispersed into the air and oceans, and through that into living things, including trees[9]. Solar activity is related to its magnetic field, so that during peak solar activity, its magnetic field is stronger than usual and acts like a shield that deflects cosmic rays away from the Earth[10]. That is why tree rings formed during times of sunspot abundance have fewer of carbon-14 isotopes and those formed when there are less sunspots have more[11].
From Solar Activity to a Little Ice Age
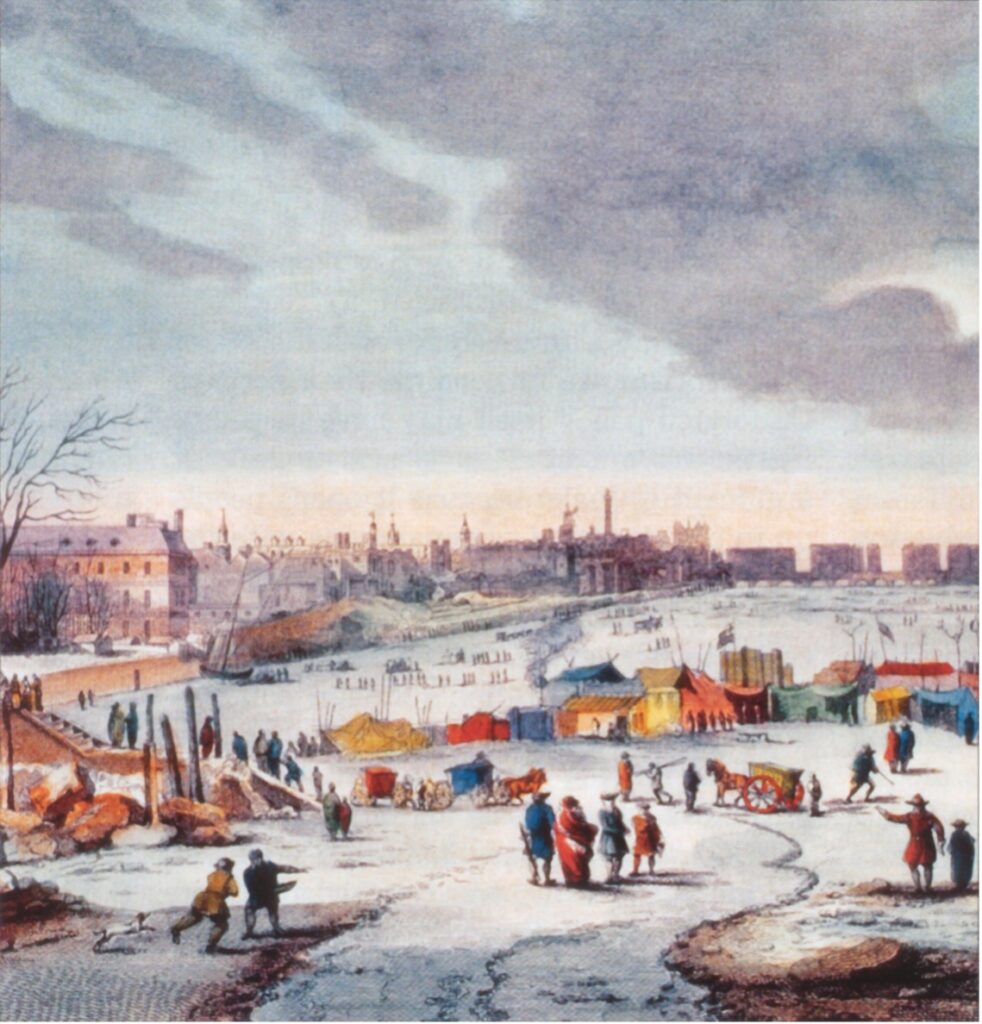
Overall, times with the most sunspots (known as solar maximum) are just one sign of the Sun being highly active. During those times, there are also increased solar flares, coronal mass ejections and brighter aurorae on Earth[12]. Although bright spots (faculae and plages) are harder to see than sunspots, they outweigh the effects of sunspots. During the solar maximum, the Sun is brighter (by about 0.1%)[13] and releases more energy[14], which has a measurable impact on our climate! The Little Ice Age was a period starting the 14th century where cooler temperatures made glaciers expand with colder winters and shorter summers[15]. Are riveting example are the Frost Fairs that were regularly held on the frozen River Thames in London until 1814[16]. While some frost formed atop in some calmer parts of the river as recently as 2021, the Thames hasn’t frozen over since 1963, which was the first time it froze in 150 years (since the final Frost Fair in 1814)[17]. While the underlying causes for this Little Ice Age are complex, it did occur during a time of unusually low solar activity, which played a clear role in this climate outcome[18].
Mechanism
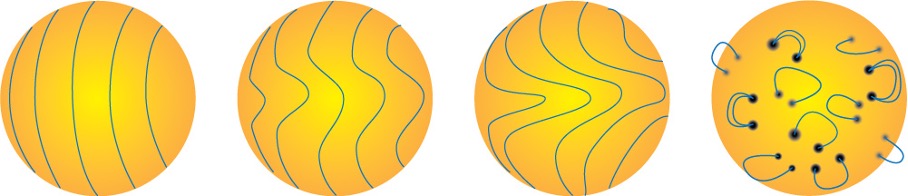
Just like the Earth, the Sun rotates around its own axis. Since the Sun isn’t a solid object, that rotation is not uniform: The central (or equatorial) regions spin around 20% faster than the polar regions[19]. Because of this differential rotation, the magnetic field lines first stretch and then become tangled and twisted until they snap—much like a wound-up rubber band—and results in twisted loops to emerge on the Sun’s surface with sunspots at the end of each loop[20].
Because of the differential rotation, sunspots usually start out in the mid-latitudes early in the solar cycle and move towards the equator as they become more numerous during solar maximum[21]. Plotting sunspots by their latitude on the sun results in a regular pattern, which is known as a butterfly diagram.

History
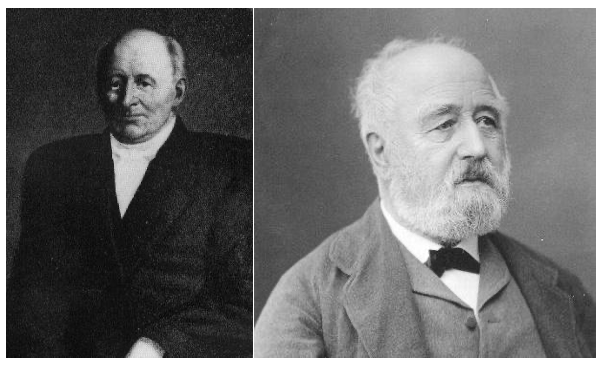
The Danish astronomer Christian Horrebow first proposed a possible regular variability in sunspot numbers in 1770 but that initial suggestion was largely forgotten[22]. It took almost another century before the German amateur astronomer Samuel Heinrich Schwabe (1789-1875)[23] used empirical data to describe the solar cycle in 1844 and measure its approximate length[24]. Because of his contribution, it is also often referred to as the Schwabe Cycle[25]. The Swiss astronomer Johann Rudolf Wolf (1816-1893)[26] analysed historical data to analyse this cycle in more detail and measure its length more accurately. Since he could not find reliable data for earlier observations, Wolf concluded that the first rigorously and reliably recorded cycle to have occurred from February 1755 to June 1766, which he named “Solar Cylce 1”[27]. This numbering is still used today: We are now in Solar Cycle 25, which is expected to peak in 2025[28].
Summary
The Sun goes through cycles of activity that last for around 11 years. During the peak activity, which is called solar maximum, numerous sunspots and faculae can be observed and other phenomena like coronal mass ejections and solar flares peak. During this time, the sun emits more energy, which impacts the Earth’s climate and solar storms are more likely. Although sunspots have been observed for millennia, the cyclical nature of them was described in detail in the 19th century by the German astronomer Samuel Heinrich Schwabe and analysed and named by the Swiss astronomer Rudolf Wolf. We are now in the 25th cycle, which is expected to peak in 2025.
[1] Morgan, B., et al., (2014). The planets: The definitive visual guide to our solar system. London, UK: DK.
[2] Pang, D. K. F. (2022). Sunspots. Sirius Geography. URL:
[3] Hathaway, D. H. (2014). Photospheric features. Solar Physics: Marshall Space Flight Center. Huntsville, AL: NASA (Marshall Space Flight Center). URL: https://solarscience.msfc.nasa.gov/feature1.shtml
[4] Stott, C., Dinwiddie, R., Hughes, D. & Sparrow, G. (2010). Space: From earth to the edge of the universe. London, UK: DK.
[5] Morgan, B., et al., (2014). The planets: The definitive visual guide to our solar system. London, UK: DK.
[6] Usoskin, I. G. (2017). A history of solar activity over millennia. Living Reviews in Solar Physics, 14(1), 1-97. https://doi.org/10.1007/s41116-017-0006-9
[7] Usoskin, I. G., Mursula, K., Arlt, R., & Kovaltsov, G. A. (2009). A solar cycle lost in 1793–1800: early sunspot observations resolve the old mystery. The Astrophysical Journal, 700(2), L154. https://doi.org/10.1088/0004-637X/700/2/L154
[8] Usoskin, I. G., Solanki, S. K., & Kovaltsov, G. A. (2007). Grand minima and maxima of solar activity: new observational constraints. Astronomy & Astrophysics, 471(1), 301-309. https://doi.org/10.1051%2F0004-6361%3A20077704
[9] Pope, B. (2022). Radioactive traces in tree rings reveal Earth’s history of unexplained ‘radiation storms’. The Conversation. URL: https://theconversation.com/radioactive-traces-in-tree-rings-reveal-earths-history-of-unexplained-radiation-storms-193080
[10] Carlson, E. K. (2020). Sun’s past hidden in tree rings. Physics, 13, 79. URL: https://physics.aps.org/articles/v13/78
[11] Morgan, B., et al., (2014). The planets: The definitive visual guide to our solar system. London, UK: DK.
[12] Morgan, B., et al., (2014). The planets: The definitive visual guide to our solar system. London, UK: DK.
[13] Hathaway, D. H. (2014). Photospheric features. Solar Physics: Marshall Space Flight Center. Huntsville, AL: NASA (Marshall Space Flight Center). URL: https://solarscience.msfc.nasa.gov/feature1.shtml
[14] National Weather Service. (n.d.). The sun and sunspots. National Weather Service. Siux Falls, SD: National Weather Service. URL: https://www.weather.gov/fsd/sunspots
[15] Jackson, S. T. (2016). Little ice age. Encyclopaedia Britannica. URL: https://www.britannica.com/science/Little-Ice-Age
[16] Atkin, E. (2022). Has the River Thames ever frozen over? Metro. URL: https://metro.co.uk/2022/12/13/has-the-river-thames-ever-frozen-over-17927810/
[17] Hopkins, R. (2015). Of climates past: 1963, the last time the River Thames froze. Transition Network. URL: https://transitionnetwork.org/news/of-climates-past-1963-the-last-time-the-river-thames-froze/#:~:text=January%201963%20was%20the%20coldest,here%20for%20the%20first%20time.
[18] Jackson, S. T. (2016). Little ice age. Encyclopaedia Britannica. URL: https://www.britannica.com/science/Little-Ice-Age
[19] Morgan, B., et al., (2014). The planets: The definitive visual guide to our solar system. London, UK: DK.
[20] Morgan, B., et al., (2014). The planets: The definitive visual guide to our solar system. London, UK: DK.
[21] Mandal, S., Karak, B. B., & Banerjee, D. (2017). Latitude distribution of sunspots: analysis using sunspot data and a dynamo model. The Astrophysical Journal, 851(1), 70. https://doi.org/10.3847/1538-4357/aa97dc
[22] Usoskin, I. G. (2017). A history of solar activity over millennia. Living Reviews in Solar Physics, 14(1), 1-97. https://doi.org/10.1007/s41116-017-0006-9
[23] Lotha, G. (2022). Samuel Heinrich Schwabe. Encyclopaedia Britannica. URL: https://www.britannica.com/biography/Samuel-Heinrich-Schwabe
[24] Usoskin, I. G. (2017). A history of solar activity over millennia. Living Reviews in Solar Physics, 14(1), 1-97. https://doi.org/10.1007/s41116-017-0006-9
[25] Usoskin, I. G. (2017). A history of solar activity over millennia. Living Reviews in Solar Physics, 14(1), 1-97. https://doi.org/10.1007/s41116-017-0006-9
[26] Encyclopaedia Britannica. (2022).Rudolf Wolf. Encyclopaedia Britannica. URL: https://www.britannica.com/biography/Rudolf-Wolf
[27] Usokin, I. G., Mursula, K., Arlt, R., & Kovaltsov, G. A. (2009). A solar cycle lost in 1793–1800: early sunspot observations resolve the old mystery. The Astrophysical Journal, 700(2), L154-L157. http://dx.doi.org/10.1088/0004-637X/700/2/L154
[28] National Weather Service. (2020). Hello solar cycle 25. National Oceanic and Atmospheric Administration. URL: https://www.weather.gov/news/201509-solar-cycle#:~:text=We%20are%20now%20in%20Solar%20Cycle%2025%20with%20peak%20sunspot,Solar%20Cycle%201%20in%201755.